How E-Commerce Managers Use Competitive Intelligence
Competitive intelligence for ecommerce managers: daily workflows, ROI frameworks, and the 5-minute review that turns pricing data into revenue growth.

Beyond Checking Competitor Prices
E-commerce managers use competitive intelligence in three daily workflows: a 5-minute morning scan of price and stock alerts on their top revenue products, midday pricing decisions 2–3 times per week using competitive position data, and weekly strategic reviews of competitor behavior patterns and catalog changes. The ROI is concrete: a $99/month monitoring tool replaces 150–250 hours/year of manual tracking ($7,500–$12,500 value) and catches pricing opportunities worth $250+/month.
But competitive intelligence goes beyond "see what competitors charge." A data-driven e-commerce manager tracks prices, yes — but also stock availability, product launches, promotional patterns, and assortment changes across their competitive set. The managers who consistently grow revenue aren't the ones with the most data. They're the ones with a daily routine that turns data into decisions.
This guide is written for e-commerce managers at growing businesses — the $1M–$20M revenue range where you've got budget for tools but need to justify every dollar to leadership.
The 5-Minute Daily Review Framework
This is the routine that separates reactive e-commerce managers from proactive ones. Five minutes every morning, compounding daily.
Minute 1: Check overnight alerts. Open your price monitoring dashboard or email alerts. How many competitor price changes happened since yesterday? Flag anything on your top 20% revenue products.
Minute 2: Review flagged changes. For each flagged change: How large is the price difference? Is it a temporary promotion or a permanent price adjustment? Does it affect your competitive position on that product?
Minute 3: Check stock alerts. Any competitors out of stock on shared products? If yes, note the product and consider whether to adjust your pricing upward or increase ad spend on that SKU.
Minute 4: Scan new products. Did any competitor add products in your categories? Star the ones worth investigating further.
Minute 5: Decide and log. Make one of three decisions for each flagged item: (a) match the price, (b) hold and monitor, or (c) investigate further. Log decisions in your tracking spreadsheet. Move on.
That's it. Five minutes. The retailers who grow consistently aren't the ones with the best instincts about pricing. They're the ones who turned competitive awareness from an occasional project into a daily habit.
The Compound Effect A 5-minute morning scan compounds to 30 hours per year of competitive intelligence — without adding staff.
The Full Workflow: Morning, Midday, Weekly
The 5-minute review covers the essentials. But the best operators also build in deeper sessions at two other cadences.
Morning: The Quick Scan (5–10 minutes)
Open your price monitoring dashboard first thing. You're looking for three things:
Price alerts from overnight. Which competitors changed prices? Focus on your top 20% of products by revenue — changes there affect your bottom line most. A competitor dropping price on a best-seller by 15% requires a same-day response. A 2% shift on a low-volume SKU can wait.
Stock alerts. Did a competitor go out of stock on something you both sell? This is a pricing opportunity. When your closest competitor can't fulfill orders on a popular product, you have pricing power you didn't have yesterday. Raise your price by 5–10% or keep it steady and capture their customers — either way, you're better off knowing about it immediately.
New product alerts. Did a competitor add products you don't carry? Product gap analysis isn't a quarterly exercise. Competitors add new SKUs regularly, and the ones that overlap with your category are potential revenue you're leaving on the table.
Midday: Decision Making (15–30 minutes, 2–3x per week)
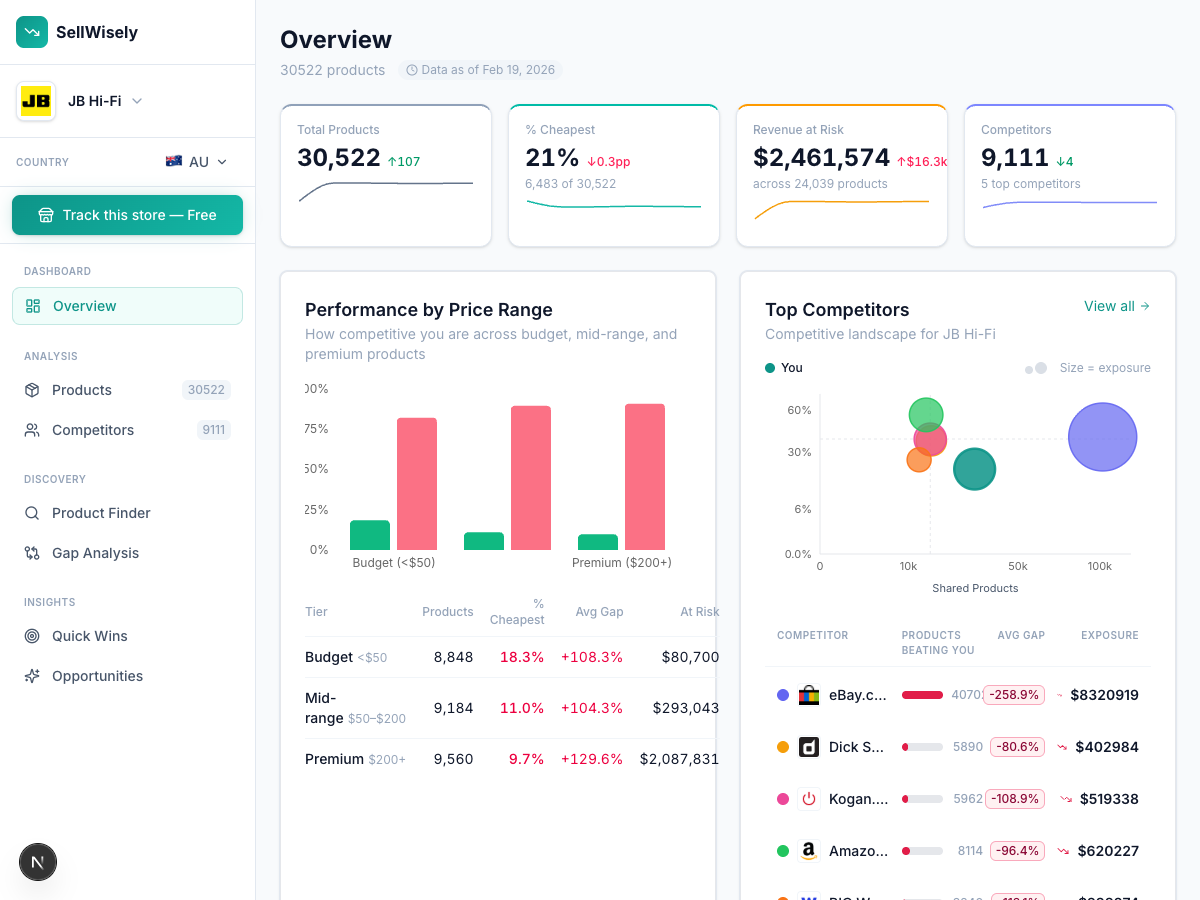
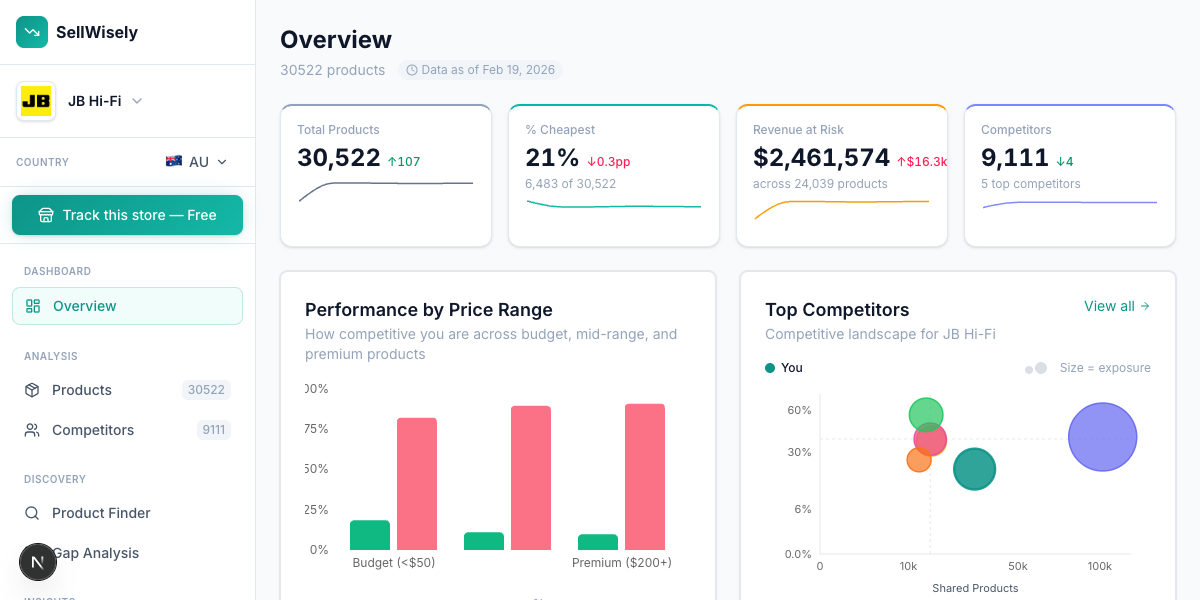
Twice or three times a week, go deeper. Pull up your competitive position overview and ask:
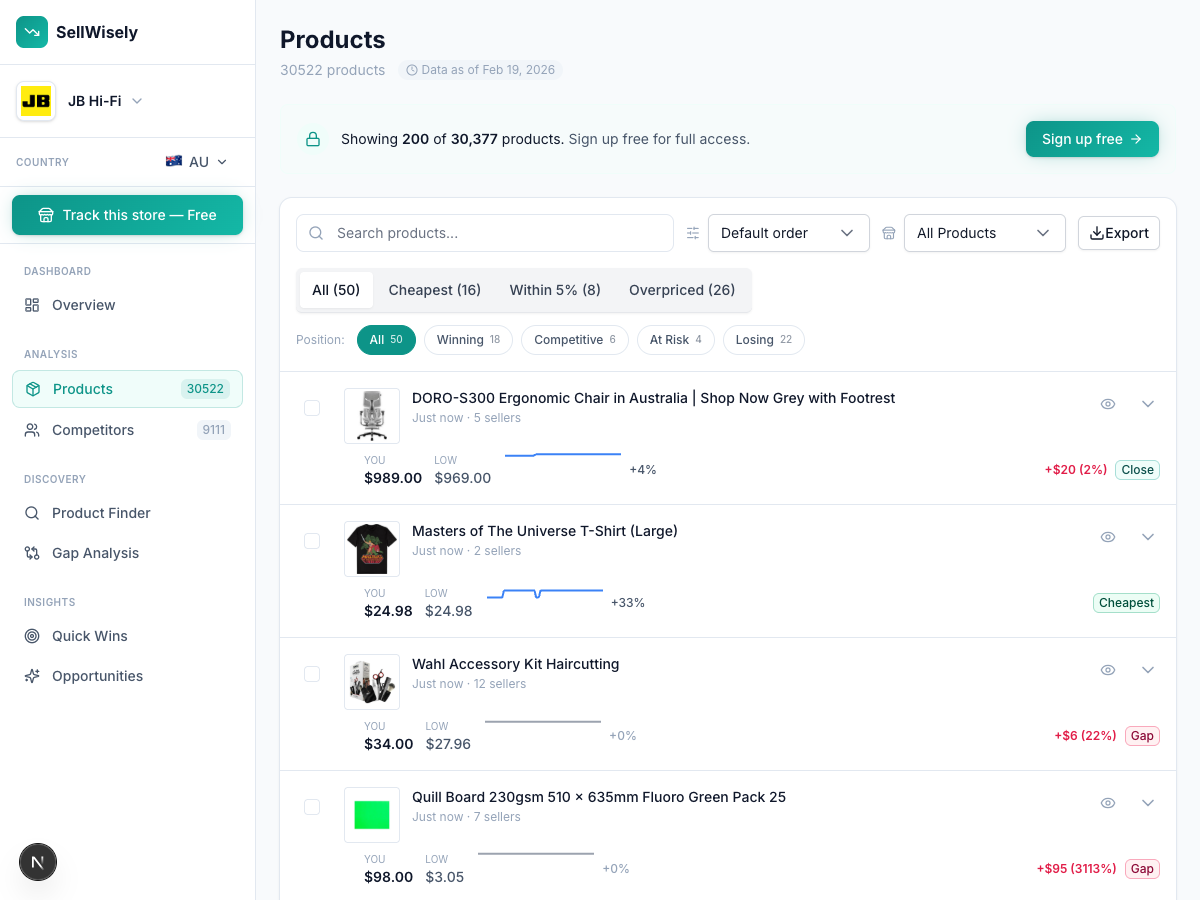
Where am I the cheapest? The percentage of your catalog where you're the lowest-priced option tells you how aggressive your pricing is. For most retailers, being cheapest on 30–40% of shared products is healthy. Below 20% and you're losing on price. Above 60% and you might be eroding margins unnecessarily.
Where am I significantly more expensive? Products where you're 15%+ above the market average need attention. Either there's a reason (you offer better service, faster shipping, exclusive bundles) or there's a pricing error. Both are worth investigating.
What trends should I act on? Price history over 30, 60, 90 days reveals patterns. A competitor gradually dropping prices on a category over two months might be clearing inventory — or repositioning. Knowing the trend helps you decide whether to match, hold, or adjust your own strategy.
Weekly: Strategic Review (30–60 minutes)
Once a week, zoom out from individual products to category-level and competitor-level patterns.
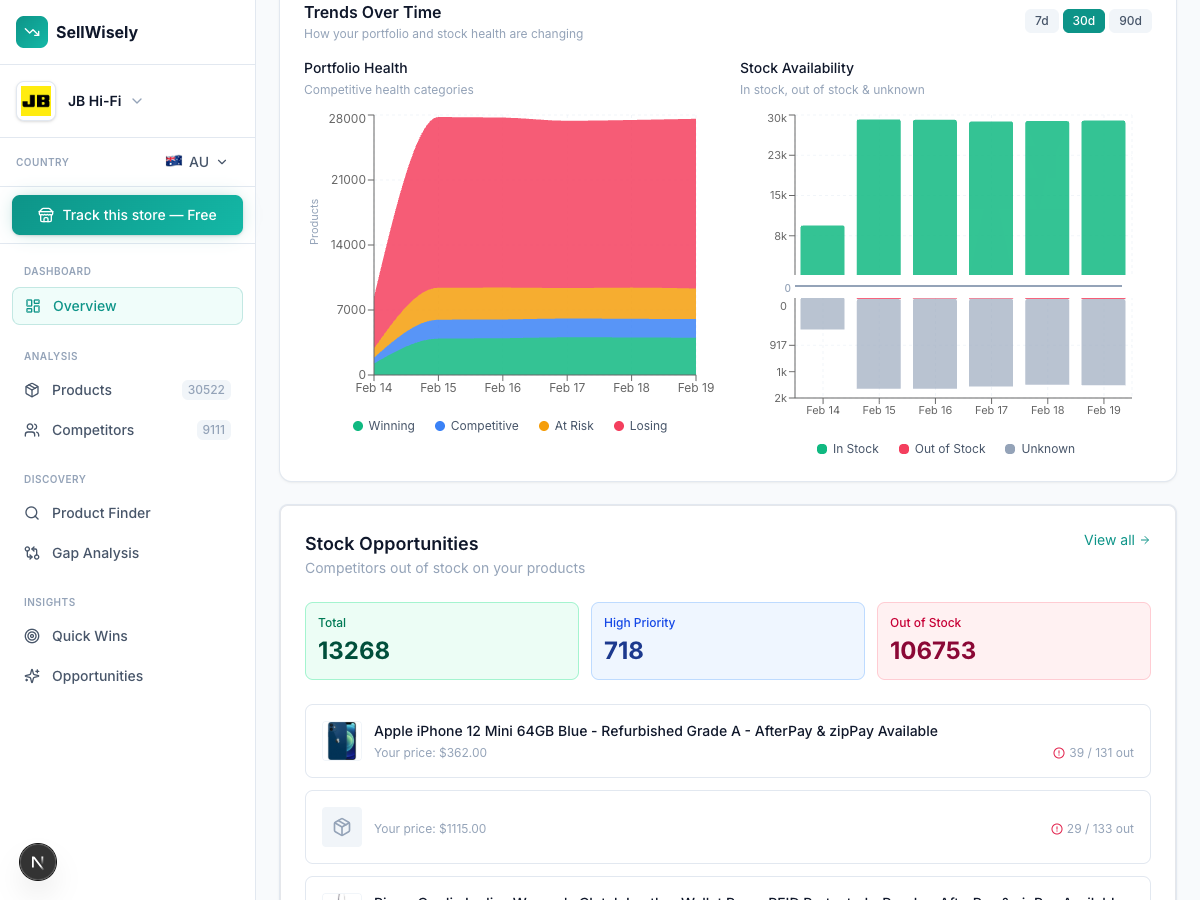
Category health check. Which product categories are getting more competitive? Which are relatively stable? If electronics margins are compressing while home goods margins hold steady, that informs where to invest marketing spend.
Competitor behavior tracking. Over time, you'll start recognizing competitor patterns. Some competitors match your prices within 48 hours. Some only adjust monthly. Some are aggressive on bestsellers but ignore long-tail products. This intelligence is worth more than any single price data point — it tells you how to play the game.
Assortment evolution. What have competitors added or removed from their catalogs over the past month? Product launches and discontinuations signal strategic direction. If three competitors all added the same product line last month, there's probably demand you're missing.
Beyond Price: What Else to Track
Price is the most visible competitive signal, but it's not the only one that matters.
Stock Availability
When competitors run out of stock, the market shifts. Customers who can't buy from their first choice look for alternatives. If you have stock and they don't, you have temporary pricing power.
Monitoring competitor stock status is operationally useful in three ways:
- Pricing opportunities: Raise prices (modestly) when competitors are out of stock on popular items.
- Demand signals: If a product is out of stock across multiple competitors, demand is outstripping supply. Consider ordering more.
- Competitive gaps: Products that are frequently out of stock at competitors but consistently available from you are a selling point worth highlighting in marketing.
Product Launches
Tracking when competitors introduce new products — especially products that overlap with your categories — gives you lead time. If a competitor launches a product you don't carry, you've got a window to decide whether to add it to your catalog before the market settles.
This is where product discovery tools earn their ROI. Instead of manually browsing competitor sites, automated gap analysis surfaces new products as they appear.
Promotional Patterns
Competitors run sales. Knowing when and how they discount tells you how to time your own promotions. If a competitor historically runs a 20% off sale every March, you can plan your counter-strategy in advance — match it, beat it, or differentiate on value rather than price.
Most price monitoring tools track list prices, not coupon-level discounts. But even list-price monitoring catches most promotions: site-wide sales, category discounts, clearance pricing, and seasonal markdowns all show up as price changes.
Building a Competitive Intelligence Stack for Ecommerce
You don't need expensive tools to start. You need a process.
The Minimum Viable Stack
One price monitoring tool. Something that tracks your competitors' prices automatically and alerts you to changes. Free options exist — SellWisely's free tier tracks 50 products with zero setup. If you're monitoring more than 50 products, expect to pay $99–$199/mo for a dedicated tool.
One spreadsheet for decisions. Track the pricing decisions you make and their outcomes. Did you match a competitor's price drop? Record the date, the product, the price change, and the sales impact over the next 30 days. This creates your own internal case study library — and it's how you prove ROI to leadership.
One routine. The stack means nothing without consistency. A daily 5-minute review beats a monthly 3-hour deep dive every time.
As You Scale
When your business reaches the point where one person can't review everything manually:
Automated alerts replace manual dashboard checks. Set thresholds: notify me when any product in my top 100 drops more than 10% at a competitor. This shifts competitive intelligence from pull (you go look) to push (it comes to you).
Historical data enables seasonal planning. With 1–3 years of competitor pricing data, you can model Q4 pricing strategies in September instead of reacting in November. One cycle of "predictable competitive response" in Q4 can be worth the annual cost of your entire intelligence stack.
API integrations connect your pricing intelligence to your workflows. If you use n8n, Make, or Zapier for other business automation, piping competitor pricing data into those workflows means pricing decisions can be partially automated. Not fully — a human should always approve pricing changes — but surfacing recommendations automatically saves hours.
ROI Justification: The Business Case for Leadership
E-commerce managers asking leadership for a $99/mo tool budget need a clear ROI story.
| Investment | Annual Cost | Return |
|---|---|---|
| Price monitoring tool | $1,188/year ($99/mo) | Automated tracking, daily alerts |
| Manual tracking replaced | — | Saves 150–250 hrs/year ($7,500–$12,500 at $50/hr) |
| Pricing opportunities caught | — | $250+/month from responding to competitor moves |
| Net ROI | — | 5–10x return on tool cost from time savings alone |
The numbers break down further by argument type.
It Saves 150+ Hours Per Year
If your team currently tracks competitor prices manually — even partially — the time cost is real.
- Manual tracking: 3–5 hours/week copying prices into spreadsheets = 150–250 hours/year
- At $50/hour loaded cost: $7,500–$12,500/year in time spent on data collection
- Tool cost: $1,188/year ($99/mo)
- Net savings: $6,312–$11,312/year
That's a 5–10x return on the tool investment, purely from time savings. But the bigger value isn't time saved. It's better decisions.
One Caught Price Drop Pays for the Tool
Prisync published a case study with Justtools, a 40-year-old Australian power tools retailer. Before Prisync, they manually monitored 30–40 SKUs per week. After: 500 SKUs monitored multiple times daily. Revenue impact: $18K AUD per month in additional revenue. On a $119/mo subscription, that's a 38x ROI.
Real-World ROI Justtools reported $18K AUD/month in additional revenue after adopting price monitoring — a 38x return on investment.
You can build a similar projection: If automated competitive intelligence helps you catch just one competitor price drop per month that you would have missed — and responding to it saves even 5 sales at $50 average margin — that's $250/month. More than the cost of most tools.
One Opportunity Pays for Itself A single caught pricing opportunity typically generates $250+ per month in recovered or gained revenue.
Blind Spots Cost More Than Tools
The cost of not knowing is often the highest cost of all. Competitors undercutting you by 15% on your best-selling product for two weeks, unnoticed? The lost revenue and customer goodwill compound quickly. Competitive intelligence is partly insurance against blind spots.
Your Competitors Already Use These Tools
If your competitors use pricing tools and you don't, you're bringing a spreadsheet to a data fight. Competera reports that their customers see a 50–80% reduction in pricing workload. Price2Spy customers at the enterprise level (like BIG W in Australia) have dedicated pricing intelligence teams. You don't need to match their investment — but having no systematic monitoring at all puts you at a structural disadvantage.

For a practical guide on getting started with price tracking — from manual methods to automated tools — see our complete guide to tracking competitor prices. And for intelligence beyond pricing, our guide on finding products your competitors sell that you don't covers the product discovery angle.
The 5-minute daily review works with any price monitoring tool. If you don't have one yet, SellWisely's free tier gets you started in seconds — enter your store URL and build the daily habit that compounds.
Ready to track your competitors' prices?
Enter your store URL and see competitor prices instantly. No signup required.
Try SellWisely Free